About
The Calgary Traffic Counts System (CalTRACS) is a web-based GIS application used to retrieve and view transportation data studies completed throughout the city. You can view data summaries and download reports in PDF or Excel formats. Citizens are able to use CalTRACS to search and view available transportation data. CalTRACS also allows businesses, such as Transportation Engineering Consultants, to obtain existing data for use in analysis and reports.
Data stored in the system is collected by the Mobility Service Design Division within the City of Calgary, and is updated with new data as it is collected and verified. If the information below does not answer your question, please contact 311.
Terms of use
The Calgary Traffic Counts System (CalTRACS) tool and the data contained within it is shared under an Open Government Licence - City of Calgary. This open government licence only applies to this tool and this tool only. Terms of Use can be found at https://data.calgary.ca/stories/s/Open-Calgary-Terms-of-Use/u45n-7awa
The Information is licensed "as is", and the Information Provider excludes all representations, warranties, obligations, and liabilities, whether express or implied, to the maximum extent permitted by law.
The information provider is not liable for any errors or omissions in the
Information, and will not under any circumstances be liable for any direct,
indirect, special, incidental, consequential, or other loss, injury or damage
caused by its use or otherwise arising in connection with this licence or the
Information, even if specifically advised of the possibility of such loss,
injury or damage.
CalTRACS data sets
The data stored in CalTRACS includes data collected as part of the regular City of Calgary transportation monitoring program that is used to provide regular updates to the traffic volume flow maps, truck percent maps, and bike flow maps. Data is also collected on behalf of internal customers with The City of Calgary for use in their work and to help make decisions and evaluations.
Internal customers use transportation data to monitor system performance, make decisions, and quantify observations. Customers of transportation data refine and smooth raw data, perform engineering calculations and analysis, evaluate performance relative to policy and performance metrics, and make recommendations. Some examples of how internal City of Calgary business units use transportation data in their day-to-day work is listed below. For any questions about these examples, please contact 311 and ask to speak directly to the business unit responsible for the area you are interested.
-
Roads business unit
- Evaluate if traffic signals and pedestrian crossing controls are warranted
- Develop intersection signal timing plans
- Identify and evaluate operational improvements
- Design pavement
- Plan road detours
-
Transportation Planning business unit
- Identify and assess bicycle facilities
- Evaluate residential speed concerns
- Identify and analyze traffic calming initiatives
- Build long-term travel models to replicate travel in the future
- Establish plans for The City's future road network
- Evaluate and design noise attenuation devices
- Develop and monitor City policies
-
Transportation Infrastructure business unit
- Oversee design of transportation projects in Calgary
-
Calgary Transit
- Plan future Transit routes
- Identify locations for transit priority measures (such as queue jumps)
The data set stored in CalTRACS only includes data collected by the City of Calgary Mobility Service Design Division, and does not include data collected by other business units, departments, and/or organizations. Please note, Stoney Trail and Deerfoot Trail are under the jurisdiction of the Government of Alberta, and therefore The City of Calgary generally does not collect data for these roadways. However, data for roads under the Province's jurisdiction may be accessed through the Alberta Transportation website at www.alberta.ca/transportation.
Collection methods
Transportation data is collected using manual count techniques as well as automatic counters. The data collection method varies depending on resources, costs, type of data to be collected, and time periods required.
Manual collection studies are studies where field personel observe and record data, and are typically limited to six-hour blocks (consisting of two hour shifts in the morning, midday, and afternoon). Manual data collection is usually completed using electronic count boards and tally sheets and is typically collected each year between April and October.
Automatic data collection is collected year-round, using various tools placed in The City's Transportation Network. Usually, pneumatic road tubes are laid across the road which detect vehicle movements as vehicles drive over the tubes. Sometimes, video data is collected along roadways and an external company, Miovision, processes the data through automatic video detection. Additionally, permanent count stations embedded in the roadway are also used to automatically collect data on a continual basis. Automatic data is typically collected for 24 hours, but may also be collected for six hours, 12 hours, or for multiple days.
Types of transportation data studies
All studies stored in CalTRACS fall into one of two categories; intersection data and segment data. When searching for data, it is important to understand the difference between intersection and segment data as it determines what type of data will be available as well as if data needs to be searched for at an intersection or beside/near the intersection (segment). Here are some details of Intersection and Segment studies, including descriptions of the study types that are included in the CalTRACS system.
Intersection data:
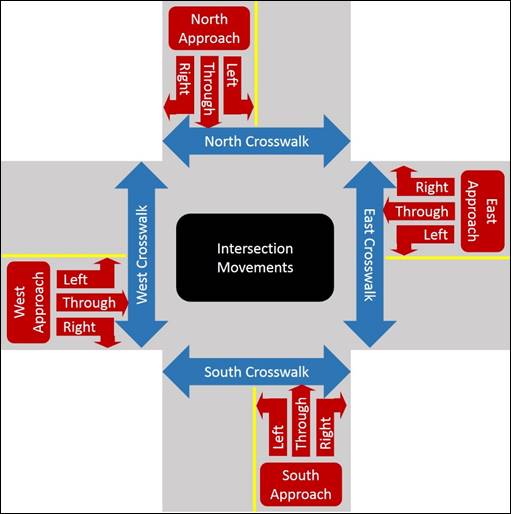
Intersection data is information at the junction of two roads and is often called a turning movement count (TMC). This data includes the number of vehicles travelling left, through, or right from all approaches to the intersection. Also, the number of pedestrians using the crosswalk on each intersection approach is often counted. Intersection data is typically collected for six hours as it is usually collected manually. However, intersection counts collected through automatic methods (such as those indicated as "Miovision") may have the time frames extended.
In CalTRACS, the
intersection data is divided into two groups, Traffic Count at Intersections (
 ) and Traffic Count at Interchanges (
 ):
):
Traffic Count at Intersections
Intersections are the point where two roads intersect and vehicles turn right, left, or travel straight through. The approaches to an intersection may include roadways, driveways, or ramps and are controlled by a signal, a roundabout, or they may be non-signalized.
For example, the east signal on 17 Avenue SW at Sarcee Trail is counted as a single Traffic Count at Intersection . This report includes vehicles approaching on 17 Avenue from east and west, and from the south via ramps from Sarcee Trail. Vehicles approaching from the west then turning right onto the loop ramp to go north on Sarcee Trail are counted as a "West Right" in the west approach section of the report. A "west right" movement is also often described as an "eastbound right turn".
Some Traffic Count at Intersection studies, called a pedestrian age breakdown, include observations of the pedestrian ages at the intersection. Each pedestrian crossing a crosswalk is counted and categorized by age.
Traffic Counts at Interchanges

Interchanges are locations where the junction of two roads is grade separated, allowing the main road to flow without interruption. The minor road typically includes several smaller intersections connected to the main road through ramps. Traffic Counts at Interchanges are a single point representation of all the movements within the interchange. These reports typically combine data from the intersections within the interchange area, as well as the through volume on the main road (obtained from segment data, described below). Typically, when converting intersection counts into interchange counts, irregular movements such as U-turns are assumed negligible.
For example, Sarcee Trail at 17 Avenue SW is an interchange where Sarcee Trail (the main road) is grade separated from 17 Avenue SW. The 17 Avenue bridge structure over Sarcee Trail has two signalized intersections, with ramps to and from Sarcee Trail. The Traffic Count at Interchange report for Sarcee Trail is an aggregation of the two traffic counts at the two signalized intersections, as well as the segment volume on Sarcee Trail. In the Traffic Count at Interchange report, the loop ramp from 17 Avenue West to Sarcee Trail North will appear as the "west left" which is the effective movement at the interchange despite the drivers not physically turning the steering wheel to the left. Meanwhile this identical volume is recorded as a "west right" in the Traffic Count at Intersection report for the east intersection of the interchange.
Traffic Count at Interchanges typically do not include pedestrian volumes at crosswalk, even when pedestrian facilities are available on the interchange. If pedestrian information is needed, refer to the individual intersection counts which form the overall interchange.
Intersection reports (both interchange and intersection) are developed from the following Study Types:
-
6 Hour Intersection Count (7:00 - 9:00, 11:00 - 13:00, 16:00 - 18:00)
- Total turning vehicle volume
- Total pedestrians on each crosswalk
- Total bike volume on roadway approaching the intersection
- Total truck volume approaching the intersection
- Also called a Standard 6 Hour Intersection Count, indicating the collection times adhere to standard six hour frames used in other studies.
-
5 Hour Intersection Count (8:00 - 9:30, 11:30 - 13:30, 15:00 - 16:30)
- Total turning vehicle volume
- Total pedestrians on each crosswalk
- Total bike volume on roadway approaching the intersection
- Total truck volume approaching the intersection
-
6 Hour All Modes Count (7:00 - 9:00, 11:00 - 13:00, 16:00 - 18:00)
- 6 hour intersection count with the addition of truck and bike turning movements
-
6 Hour Pedestrian Age Breakdown (7:00 - 9:00, 11:00 - 13:00, 16:00 - 18:00)
- 6 hour Intersection count with the addition of pedestrians categorized by age on each crosswalk
-
School 6 Hour Count (7:30 - 9:30, 11:30 - 13:30, 14:30 - 16:30)
- 6 hour intersection count (count hours shifted to match typical school hours)
- Pedestrians categorized by age on each crosswalk
-
Miovision All Modes (study hours vary)
- Intersection count with total turning vehicle volume as well as truck turning movements and bike turning movements.
- Total pedestrians on each crosswalk
- Hours of collection may be extended (including 24-hour, or multi-day)
-
Miovision Bike Junction (study hours vary)
- Bike turning volume
- Hours of collection may be extended (including 24-hour, or multi-day)
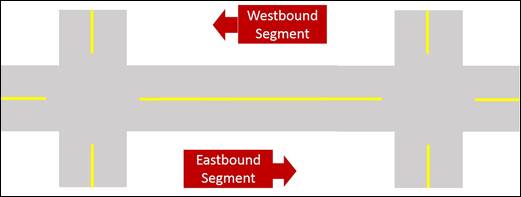
Segment data:
Segment data is information on a section of road (or pathway) between two intersections. This data only includes travel in a straight line and does not include any turning movement. Segment data is typically collected using automated tools over a 24-hour period or longer. These studies may include data such as total volume, vehicle classification, and speed. The data collection location is described as a relative bearing from an intersection or the section of road between two intersections.
In CalTRACS,
Segment data is separated into regular segment data (Traffic Counts at Segment
 ) and permanent count station segment data (Traffic Counts at Perm
Station
) and permanent count station segment data (Traffic Counts at Perm
Station
 ).
).
Traffic Counts
at Segment

Traffic Counts at Segment are segment counts obtained from non-permanent data collection devices such as hoses or video cameras. Automated collection devices are temporarily placed on or near straight sections of roadways and pathways by data collection technicians. At the conclusion of the study, data collection technicians retrieve the device and download the data, and will relocate the collection device to other locations throughout the City. Most Traffic Counts at Segment studies are 24-hours long.
Traffic Counts
at Perm Station

Traffic Counts at Perm (Permanent) stations are a specific type of segment count which is collected continuously through a device permanently embedded in or beside a road. The continuous data collection allows analysis of daily, weekly, seasonal, or annual trends. Data from permanent count locations are often used to identify factors which can be applied to other data studies, often to account for seasonal or daily variations in traffic. In CalTRACS, each Traffic Counts at Perm Station study is one year in length.
Segment data reports are developed from the following types of segment data studies:
-
Volume
-
24 Hour Automatic
- 24 Hour vehicle volume expressed as total of all vehicle types
-
Permanent Station Volume
- Vehicle volume collected continuously (total of all vehicle types)
- Data reports also include Average Annual Weekday Conversion Factors (which can be used for Seasonal adjustments of other counts)
-
24 Hour Automatic
-
Vehicle Classification
-
Vehicle Classification
- 24 hour vehicle volume classified into 13 Categories
-
Permanent Station Classification
- Vehicles classified into five categories (collected continuously through technology permanently embedded in roadways)
-
Miovision Three Bin
- Vehicles classified into three categories (collected through video processing)
-
Miovision Five Bin
- Vehicles classified into six categories (collected through video processing)
-
Vehicle Classification
-
Speed
-
Speed 1
- Speed measurements for lower speed roads (collected using pneumatic road tubes placed across roadways)
-
Speed 2
- Speed measurements for higher speed roads (collected using pneumatic road tubes placed across roadways)
-
Speed 3
- Speed measurements classified into 10 kph increments (collected using pneumatic road tubes placed across roadways)
-
Permanent Station Speed
- Speed measurements (collected continuously through technology permanently embedded in roadways)
-
Speed 1
-
Other Studies:
-
Miovision Pathway
- Pedestrian and bike volumes on a pathway (collected through video processing)
-
Miovision Sidewalk
- Pedestrian and bike volumes on a sidewalk (collected through video processing)
-
Miovision Pathway
The following two tables illustrates the specifics of each study type to help users of CalTRACS locate specific data elements that they may be looking for. When searching for specific kinds of data, it might be helpful to look at multiple study types. For example, when looking for AM and PM vehicle intersection turning movements, the data may be found in several study types such as 6-hour intersection counts, 6-hour Pedestrian Age Breakdown, 6-hour All Modes Count, or Miovision All Modes, and one of these studies might be more recent than the others.
|
Study Type |
Study Hours |
Turning Movements |
Crosswalk Information |
Approach Totals |
Collection Tool |
|||||
|---|---|---|---|---|---|---|---|---|---|---|
|
Vehicle (incl.Trucks) |
Trucks |
Bike |
Total Pedestrian Crossings |
Pedestrian Age Breakdown |
Vehicle (incl.Trucks) |
Trucks |
Bike |
|||
|
6 Hour Intersection Count |
07:00-09:00, 11:00-13:00, 16:00-18:00 |
Y |
|
|
Y |
|
Y |
Y |
Y |
Manual Collection
|
|
5 Hour Intersection Count |
08:00-09:30, 11:30-13:30, 15:00-16:30 |
Y |
|
|
Y |
|
Y |
Y |
Y |
Manual Collection |
|
6 Hour All Modes Count |
07:00-09:00, 11:00-13:00, 16:00-18:00 |
Y |
Y |
Y |
Y |
|
Y |
Y |
Y |
Manual Collection
|
|
6 Hour Pedestrian Age Breakdown |
07:00-09:00, 11:00-13:00, 16:00-18:00 |
Y |
|
|
Y |
Y |
Y |
Y |
Y |
Manual Collection |
|
School 6 Hour Count |
07:30-09:30, 11:30-13:30, 14:30-16:30 |
Y |
|
|
Y |
Y |
Y |
Y |
Y |
Manual Collection |
|
Miovision All Modes |
Varies by study May include 24 hour |
Y |
Y |
Y |
Y |
|
Y |
Y |
Y |
Miovision Camera |
|
Miovision Bike Junction |
Varies by study May include 24 hour |
|
|
Y |
|
|
|
|
Y |
Miovision Camera |
Notes regarding Intersection Studies:
- Vehicle turning movements include truck volumes (bikes are not counted as vehicles)
- Vehicle turning movements include truck volumes even when the truck turning volumes are counted separately
- Truck volumes in intersection counts include buses
- Bike volumes include bikes travelling on the roadway, within on-street bike facilities, as well as on pathways and sidewalks adjacent to the intersection
- Pedestrian crosswalk totals include all pedestrians crossing an intersection approach within a crosswalk. The direction the pedestrian travels in the crosswalk is not counted. A pedestrian may be counted more than once if they use multiple crosswalks.
- Interchange reports may be the aggregation of data from any type of the intersection count study, however, pedestrians and bicycles are typically eliminated from the interchange summary
|
Study Type |
Data Type |
Vehicle Types |
Length of Study |
Collection Tool |
|---|---|---|---|---|
|
24 hour automatic |
Vehicle Volume |
Total vehicles (not classified) |
24hrs+ |
Pneumatic Road Tubes |
|
Permanent Station Volume |
Vehicle Volume (& Average Annual Weekday Conversion Factors) |
Total vehicles (not classified) |
24hrs-365days |
Permanent Count Station |
|
Vehicle Classification |
Vehicle Classification |
13 vehicle classes |
24hrs+ |
Pneumatic Road Tubes |
|
Miovision Three Bin |
Vehicle Classification |
3 vehicle classes |
24hrs+ |
Miovision Camera |
|
Miovision Five Bin |
Vehicle Classification |
6 vehicle classes |
24hrs+ |
Miovision Camera |
|
Permanent Station Classification |
Vehicle Classification |
5 vehicle classes |
24hrs-365days |
Permanent Count Station |
|
Speed 1 |
Speed (lower speed road) |
Total vehicles (not classified) |
24hrs+ |
Pneumatic Road Tubes |
|
Speed 2 |
Speed (higher speed road) |
Total vehicles (not classified) |
24hrs+ |
Pneumatic Road Tubes |
|
Speed 3 |
Speed (10 kph increments) |
Total vehicles (not classified) |
24hrs+ |
Pneumatic Road Tubes |
|
Permanent Station Speed |
Speed |
Total vehicles (not classified) |
24hrs - 365days |
Permanent Count Station |
|
Miovision Pathway |
Pedestrian & Bike Volume |
Pedestrian, Bike |
24hrs+ |
Miovision Camera |
|
Miovision Sidewalk |
Pedestrian & Bike Volume |
Pedestrian, Bike |
24hrs+ |
Miovision Camera |
Study results
Studies can be located by using the several search functions within CalTRACS (See the section on "How to Navigate CalTRACS" for information on how to search for study locations). After a study location has been selected by clicking "View Studies", the various studies will appear on the left side of CalTRACS. You can choose from three different types of reports to view each study: 1)"Quick View" summary reports within the left-hand side of the CalTRACS window, 2) PDF reports (download), and 3) Excel reports (download).
-
Quick View summary reports
- Includes summary statistics for the study and does not require the user to download additional files. These reports provide quick access to information; however, it does not include all the details available in the PDF report or the Excel spreadsheet download.
-
PDF reports
- Contain a standardized PDF report that is generated for each study type. These reports include formatted and labelled data sets providing both raw data and summary statistics. The formatting and labeling contained in the PDF reports make these reports appropriate for most users, and they may be printed and incorporated into other reports.
- PDF reports are not available for permanent station classification and permanent station speed studies. Meanwhile, the permanent station volume studies only include a PDF report showing summary statistics for the year (including season variation factors). The full set of data is instead available in the Excel reports.
- Details on how to read the PDF reports for the various studies is included in the section on how to read Traffic Count Reports.
-
Excel reports
- Excel reports include the raw data which can be further processed using Excel or the data can be easily uploaded into other analysis tools. The Excel reports provide advanced data users with the flexibility to use data in their analysis without having to do manual data entry.
- The user of Excel reports will need to ensure the data is used and labelled appropriately within their own reports and analysis as the Excel reports generated by CalTRACS do not include data labels and notations. In cases where the data labels in the Excel reports are not clear, refer to the corresponding PDF report which will include data labels.
- For all Permanent Count station Excel reports, details regarding the data labels may be found in the section of how to read Traffic Count Reports.
How to navigate CalTRACS
To help you get started using CalTRACS, below are some explanations for common functions in this web system.
1)GIS layers
![]()
List of GIS layers and legend used in the system
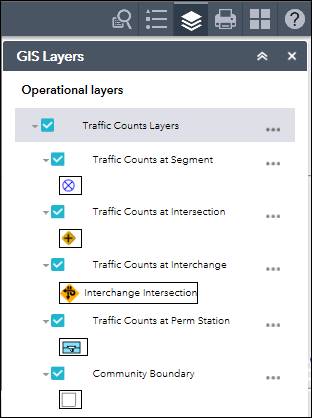
Tips:
- User can turn on/off a GIS layer by clicking the check-box
- User can expand/collapse a GIS layer by clicking the small triangle
- Some layers may not be visible at certain zoom levels
2)Print
![]()
Creates a PDF map file of the map content within the current map window
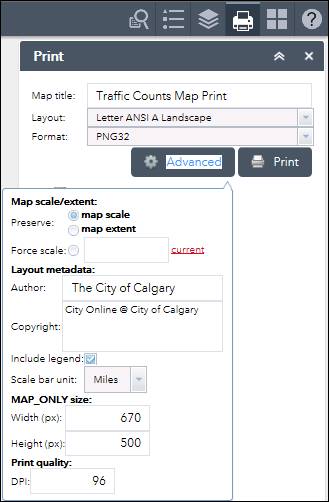
Tips:
- User can give a meaningful map title, select paper size and file format, etc.
- Click "Advanced" to have more printing options to select print quality and map sizes as shown above.
3)Basemap gallery
![]()
List all basemaps
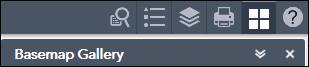
Tips:
- User can click any map icon to change the background map.
4)Map tools
-
Zoom in

-
Zoom Out

-
Previous Extent

-
Next Extent

-
Default Extent

-
My Location

-
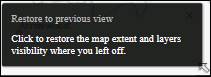
Restore previous view
- Button is only available temporarily when reopening a new CalTRACS session
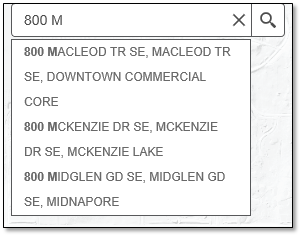
5)Find location by address or place

Tips:
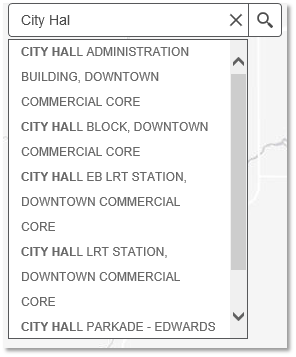
- As the user types, the system generates possible matches.
- User can find a location by a common place name.
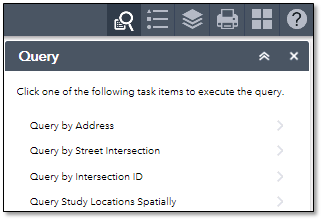
6) Query study by locations
![]()
CalTRACS provides different ways to query traffic counts by location
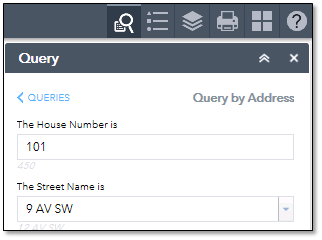
Query study by address
Tips:
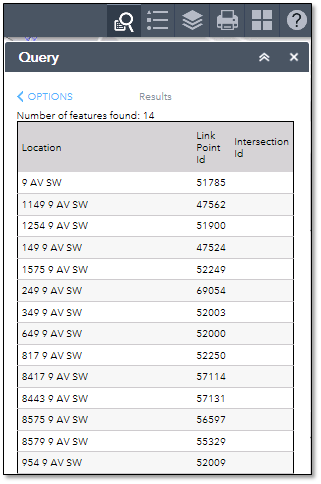
- User can enter a specific address (e.g. 101 9 Av SW which is the address for the Calgary Tower) and click the "Search" button. All traffic counts studies within * meters buffer will be listed to allow the user to choose a study to view.
- User can enter a street name and leave "The House Number is" empty and click the "Search" button. All traffic counts studies along this street will be listed to allow the user to choose a study to view.
Query by street Intersection
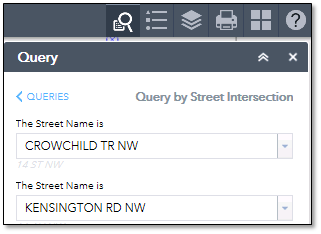
Tips:
- User can enter two street names as an intersection and click "Search" to find traffic count studies around that intersection.
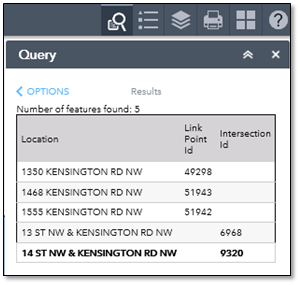
Query by intersection ID
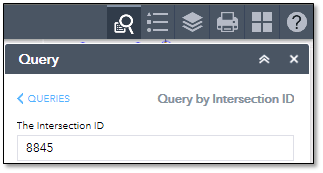
Tips:
- User can enter the intersection I.D. and click "Search" to find all traffic counts at that location. The intersection I.D. is recorded on intersection reports. This may be helpful to locate count reports for additional years when the user already has a report for that location.
Query study locations spatially
Studies may be located in an area on the map using a spatial query. This is helpful if you are looking for a study in a community or along a corridor.
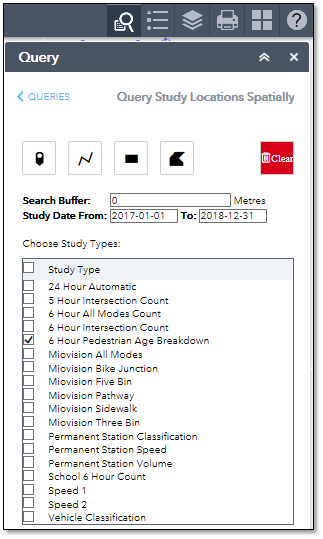
Tips:
-
Before searching for traffic studies, user needs to:
- Select a geometry shape (Point, Line, Extent, Polygon)
- Enter a buffer distance in meters
- Select 'Study Type'. The default is all study types selected. User can click 'Study Type' to turn on/off all the types. User can select a specific study type as well.
- User draws a geometric shape (e.g. a polygon) and click 'Search'. All the studies within buffer distance of the shape will be listed.
- Study dates may also be specified to focus a search to a specific time frame.
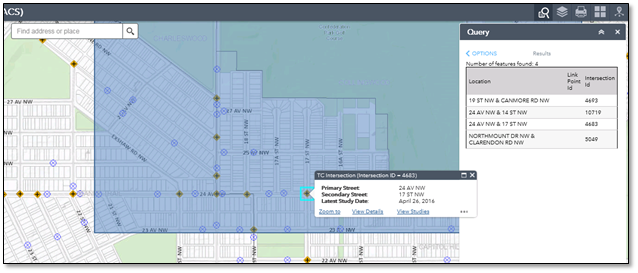
7) View count study
To view count
studies in CalTRACS, the locations must be actively selected. To actively
select a locations, one of the above search queries may be used and selecting a
location from the list of query results. Alternatively, a location may be
selected by clicking on one of the Traffic Count icons (
 ,
,
,
) in
the map
.
,
,
,
) in
the map
.
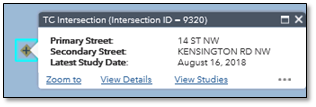
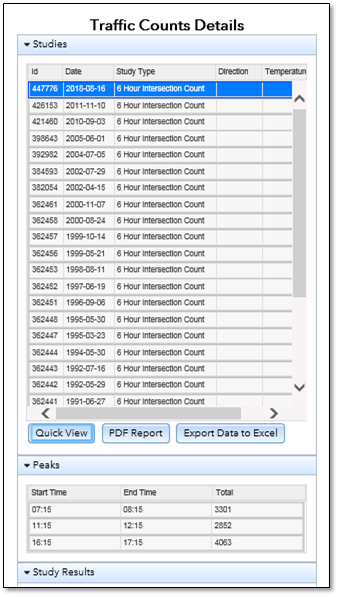
With the location actively selected, click "View Studies" from the dialogue box beside the selected location on the map. A box showing traffic count details will open in the left panel which contains studies listed by date, type, direction, and more. Select one study from the list, then select the type of report to generate (Quick View, PDF, or Excel). PDF reports will not be available for most permanent count data studies.
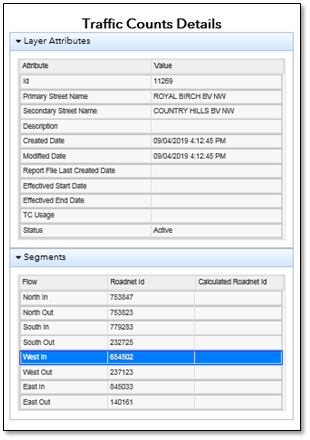
8) Associating approach description to map
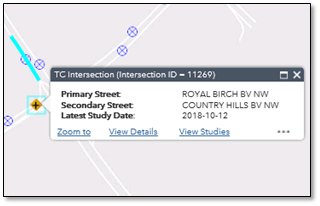
The reports from CalTRACS typically use cardinal directions to indicate road approaches (such as 'north approach') rather than indicating the specific roadway name. Many roadways are oriented such that it might be difficult to confirm which approach in the report corresponds to which roadway (for example, intersections where the roads are set at a 45 degree angle rather than north/south and east/west). The approach direction indicated in reports may be confirmed using CalTRACS tools that highlight portions of the map. Select the "View Details" option from the dialogue box for the active intersection. In the left panel, click "Segments" then select a direction of travel, which will then highlight the corresponding intersection leg on the map.
For example, Country Hills Boulevard at Royal Birch Boulevard NW (112 Avenue NW) is a skewed intersection. When reviewing the intersection report, it may be unclear from the traffic count intersection report if Country Hills Boulevard is the east and west approach, or if it is the north and south approach. To confirm, click "View Details", then "West In" from the segment list, and a section of Country Hills Boulevard is highlighted. This means that Country Hills Boulevard is the east and west approaches, Royal Birch Boulevard is the south approach, and 112 Avenue NW is the north approach.
How to read Traffic Count reports
To help you read some of the traffic count reports from CalTRACS, below are some explanations for common reports.
Traffic Count intersection report
Standard 6-hour intersection counts:
For standard 6-hour intersection counts, data is collected in three time periods for two hours each, resulting in a total of 6 hours. Standard 6-Hour Intersection reports use the following time periods.
AM 07:00 - 09:00
Mid-day 11:00 - 13:00
PM 16:00 - 18:00
Data is saved in 15 minute increments.
- The data collection times for Standard 6-hour intersection counts are identical to the 6-hour Summary indicated in 24-hour Volume Automatic reports collected on segments between intersections. These data collection times are standardized to enable comparisons between various types of studies.
Non-standard (Other) intersection counts :
School Counts, and 5 hours intersections counts, and other custom studies may have different study lengths and time periods for data collection. Refer to the report to confirm data collection times.
Main Headings
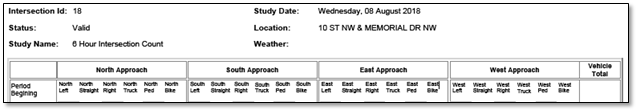
There are four main columns with cardinal headings. Each column contains the observed volumes of vehicles, trucks, pedestrians and bikes as well as calculated numbers for each indicated approach. Vehicles, trucks & bikes are counted as they approach the intersection. Pedestrians are counted as they cross the approach.
North Approach: This leg contains the observed data and calculations for the north approach to the intersection.
- This section contains vehicle data which is often described as "Southbound" data
- Pedestrian data is described as pedestrians in the crosswalk on the north leg
South Approach: This leg contains the observed data and calculations for the south approach to the intersection.
- This section contains vehicle data which is often described as "Northbound" data
- Pedestrian data is described as pedestrians in the crosswalk on the south leg
East Approach: This leg contains the observed data and calculations for the east approach to the intersection.
- This section contains vehicle data which is often described as "Westbound" data
- Pedestrian data is described as pedestrians in the crosswalk on the east leg
West Approach: This leg contains the observed data and calculations for the west approach to the intersection.
- This section contains vehicle data which is often described as "Eastbound" data
- Pedestrian data is described as pedestrians in the crosswalk on the west leg
Sub headings
Period Beginning: This identifies the start time of each 15-minute increment.
(Direction) Left: Vehicles approaching an intersection and making a left turn.
- For example, "North-Left" describes a vehicle travelling from the north then turning left at the intersection. This is also often called the "Southbound Left" (or SBL for short)
(Direction) Straight: Vehicles approaching an intersection and continuing through.
- For example, "North-Straight" describes a vehicle travelling from the north then continuing straight through the intersection. This is also often called the "Southbound Through" (or SBT for short)
(Direction) Right: Vehicles approaching an intersection and making a right turn
- For example, "North-Right" describes a vehicle travelling from the north then turning right at the intersection. This is also often called the "Southbound Right" (or SBR for short)
(Direction) Truck: The number of trucks included in the above movements. A truck is defined as any vehicle with more than four wheels (except pickups).
- For example, "North-Truck" describes the total number of trucks approaching the intersection from the north. This is also often called the "Southbound Trucks"
- Trucks are also counted as vehicles in the vehicle turning movements.
- Buses are included as trucks.
(Direction) Pedestrians: Pedestrians that cross that leg of the intersection.
(Direction) Bike: Bicycles that approach from the same direction regardless of any turning movements.
- Bikes are not counted as vehicles in the vehicle turning movements.
- Bikes on sidewalks and/or adjacent pathways are also included and the direction of travel of the bike is captured (regardless of which side of the road the bike travels on).
Vehicle Totals: The total vehicles for each 15-minute period.
The observed volumes for each 15-minute increment are recorded below the sub-headings.
Calculations for each time period
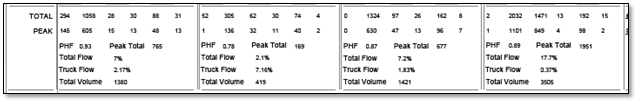
Below the field data for each two hour period, a series of tabulated and summarised information is shown. Each row of calculated data is described as follows:
TOTAL : Refers to the sum of the 15-minute increments for each heading, over the 2-hour count period.
PEAK: Refers to the peak hour volume, which is the sum of the four highest, consecutive vehicle volume 15-minute intervals for all approaches. Each of the four peak consecutive 15-minute intervals has their corresponding "Period Beginning" time underlined.
PHF: Refers to the Peak Hour Factor, which is calculated for each cardinal direction as a ratio of the peak one hour volume divided by four times the peak 15-minute interval volume.
Total Flow : Refers to the percentage of the six-hour total traffic volume that occurs on the approach during the two-hour count period.
Truck Flow: Refers to the percentage of trucks included in the two-hour total traffic volume that occurs on the approach.
Total Volume: Refers to the total volume of vehicle traffic that occurred on the approach for that count period.
Calculations for the entire study period
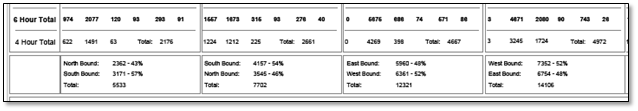
Below the field data and calculations for all time periods is a series of tabulated and summarised information. Each row of calculated data is described as follows:
6-Hour Total: Refers to the grand total of each of the sub-headings for all time periods.
(Note: the total vehicle volume for the entire intersection is in the far right column)
4-Hour Total: Refers to the vehicle volume for each movement and the total vehicle volume for the AM and PM time periods combined.
"Bound" Totals
This indicates the number of vehicles travelling in each direction and the percentage of the total that number represents for each leg of the intersection. The numbers are calculated as follows:
North Leg: North Bound = sum of South Straight, East Right & West Left
South Bound = sum of North Left, North Straight & North Right
South Leg: South Bound = sum of North Straight, East Left & West Right
North Bound = sum of South Left, South Straight & South Right
East Leg: East Bound = sum of North Left, South Right & West Straight
West Bound = sum of East Left, East Straight & East Right
West Leg: Westbound = sum of North Right, South Left & East Straight
Eastbound = sum of West Left, West Straight & West Right
24 hour automatic volume report
Data is collected:
- For a minimum of 24 hours
- By direction
- In 15 minute increments
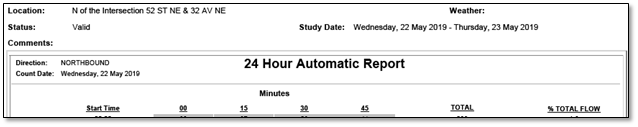
Location: Describes which cardinal direction the count was done from an intersection
- Location is typically relative to a nearby intersection.
"W of" = west of
"E of" = east of
"N of" = north of
"S of" = south of
Study Date: The start and end dates of the study (for a single day study the dates will be one day apart and for a multi-day study, the entire date range will appear)
24 Hour Automatic Report (first table - first direction)
Direction: The first direction of travel. On two-directional roads (typically undivided roads) it will be either Northbound or Eastbound. On one-way roads it will be the direction of travel. Some counts have only Total directions. These may be one way roads or two-way roads that were not counted by direction (older counts only).
Count Date: The start date (on multi-day counts, this will be the data for that date)
Start Time:The hour the count starts in 24-hour clock
Minutes: The start time of the four 15-minute time increments
Total:The hourly total
% Total Flow: The percentage of the daily directional flow that occurs in that hour
Table summary (for each direction)
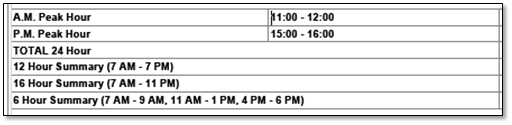
A.M Peak Hour : The time and volume of the highest one hour period calculated by the sum of the highest consecutive 15 minute volumes in the AM time period plus the % of the total flow for that direction.
- The A.M. Peak Hour is determined using all data collected for the segment in the A.M. hours and is not limited to the typical morning rush hours. The peak hour for nearby intersections may differ as they may be calculated using only the 7:00-9:00 time period, and, they are determined using data from all approach roads rather than a single segment.
P.M Peak Hour: The time and volume of the highest one hour period calculated by the sum of the highest consecutive 15 minute volumes in the PM time period plus the % of the total flow for that direction.
Total 24 Hour:The 24-hour volume for that direction.
- Reports may be generated on days where data was collected for less than 24 hours that day. In these cases, less than 24 hours of volume may be presented however it is still labelled as 24 hours.
12 Hour Summary: The total volume between the hours of 7:00 AM & 7:00 PM for that direction.
16 Hour Summary: The total volume between the hours of 7:00 AM & 11:00 PM for that direction (these were the original screenline hours which have now been amended to 6:00 AM to 10:00 PM).
6 Hour Summary: The total volumes for the hours: 7:00 - 9:00; 11:00 - 13:00 & 16:00 - 18:00 for that direction (these are the standard 6 hours used for intersection counts).
24 hour automatic report (second table - second direction)
Direction: The second direction of travel (either Southbound or Westbound)
All the above descriptions apply to the second direction as well.
24 hour automatic report (third table - total of both directions)
Direction:Total (the sum of the two directions)
The above descriptions and calculations apply to the Total volumes.
In addition, the Total report also includes:
Daily Expansion Factor:
- This is the factor used to convert standard six hour counts to daily volumes and it is calculated by dividing the 24-hour volumes by the 6-hour volumes. This calculation is only made on total volumes.
- This factor may be useful to expand a standard six hour count into a 24-hour intersection volume.
- Be sure that the daily expansion factor is only applied to counts which follow the standard six hour count times indicated here (intersection counts collected during school hours should not be expanded using this factor as those hours are not the same as those used to calculate this expansion factor).
Automatic vehicle classification report
Data is collected:
- For a minimum of 24 hours
- By direction
- In 15 minute increments but summarized in one hour increments
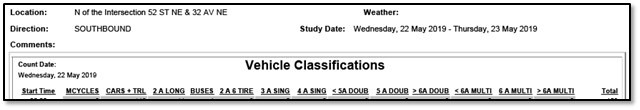
Location: Describes which cardinal direction the count was done from an intersection
- Location is typically relative to a nearby intersection.
"W of" = west of
"E of" = east of
"N of" = north of
"S of" = south of
Direction:The direction of travel
Study Date: The start and end dates of the study (for a single day study the dates will be one day apart and for a multi-day study, the entire date range will appear)
Count Date : The start date (on multi-day counts, this will be the data for that date)
Start Time:The hour the count starts in 24-hour clock
Vehicle Classifications:
- These headings are the vehicles classes included in the study.
- Hourly volume for each class is shown under the headings.
-
The number of vehicle classes in the report is
dependent on the study type
-
Regular Segment:
- Vehicle Classification: 13 classes
- Miovision 3 bin: Three classes
- Miovision 5 bin: Six classes
-
Permanent Station on Segment:
- Perm Station Classification: Five classes
-
Regular Segment:
Total: The total hourly volume for all classes
Daily Totals:The 24-hour total for each class of vehicle
% of Total:The % of the daily total that each class represents
Automatic speed report
Data is collected:
- For a minimum of 24 hours
- By direction
- In 15 minute increments but summarized in one hour increments
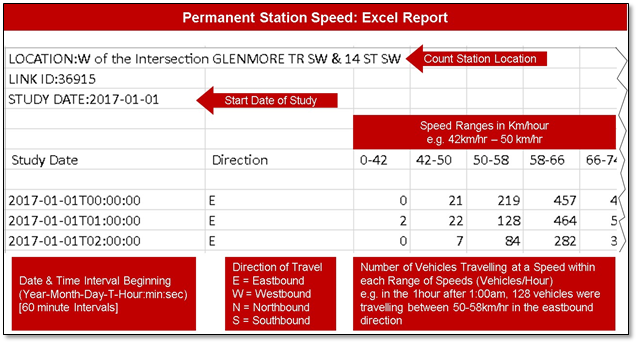
Location: Describes which cardinal direction the count was done from an intersection
Direction:The direction of travel
Study Date: The start and end dates of the study (for a single day study the dates will be one day apart and for a multi-day study, the entire date range will appear)
Posted Speed: If the speed study is done in a Playground or School Zone, the posted speeds are shown, otherwise this is blank
Zone Hours:The applicable hours of the Zone:
School and Playground Zones:
Since 2014:
Playground Zones: 7:30 - 21:00
(In 2014, all Playground Zones and School Zones in Calgary were combined into Playground Zones with year-round defined hours of operation of 7:30 - 21:00)
Before 2014:
School Zones: Prior to Aug. 1, 2010 8:00 - 17:00
After Aug. 1, 2010 7:30 - 17:00
Playground Zones: 8:30 until 1 hour after sunset (end times vary)
All other Areas (outside School and Playground Zones):
No Zone: 00:00-23:59 (i.e. the entire 24 hours)
Count Date: The start date (on multi-day counts, this will be the data for that date)
Start Time:The hour the count starts in 24-hour clock
Speed Classifications: These headings are for the standard 13 speed classes in kilometers per hour. The hourly volume for each class is shown under the headings.
Total: The 24-hour total vehicle volume for each speed class
Cumulative Total: Starting with vehicles at the lowest speed, the accumulated total of vehicles included in the speed study
Cumulative %: The percentage of the daily total the cumulative total represents
Total Hours:
Average Speed: The average speed of all vehicles included in speed study for the 24 hours
85th Percentile: The speed at or below which 85 % of the vehicles included in speed study are travelling
Total Vehicles: The total number of vehicles counted in 24 hours
In the case of School Zones & Playground Zones there are additional calculations
Zone Hours:
Average Speed: The average speed of all vehicles included in speed study during the zone hours
85th Percentile: The speed at or below which 85 % of the vehicles included in speed study are travelling during the zone hours
Total Vehicles:The total number of vehicles counted during the zone hours
Remaining Hours:
Average Speed: The average speed of all vehicles included in speed study during the non-zone hours
85th Percentile: The speed at or below which 85 % of the vehicles included in speed study are travelling during the non-zone hours
Total Vehicles:The total number of vehicles counted during the non-zone hours
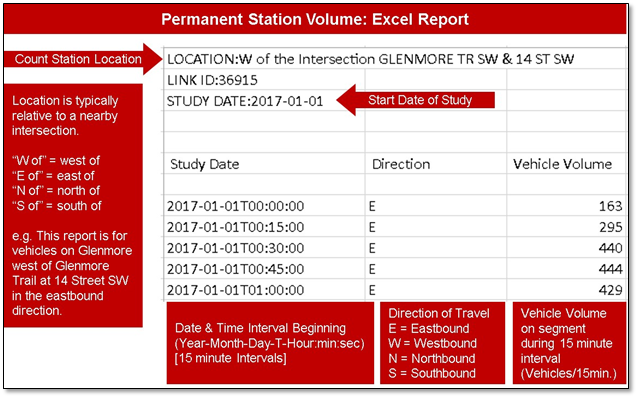
Permanent station excel reports
Permanent station data is available in the quick view or in Excel reports. Following are details of how to read the volume, speed, and classification Excel reports for permanent count stations.
Permanent station volume
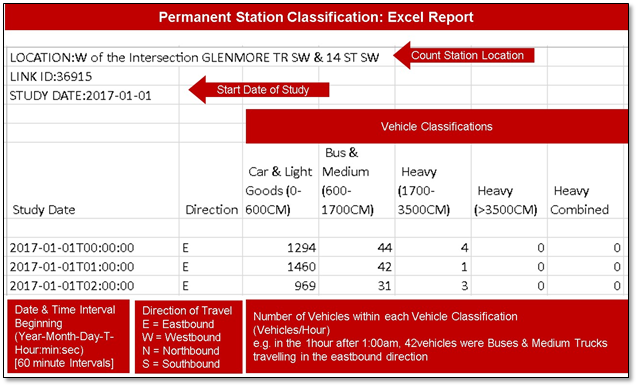
Permanent station classification
Permanent station speed